
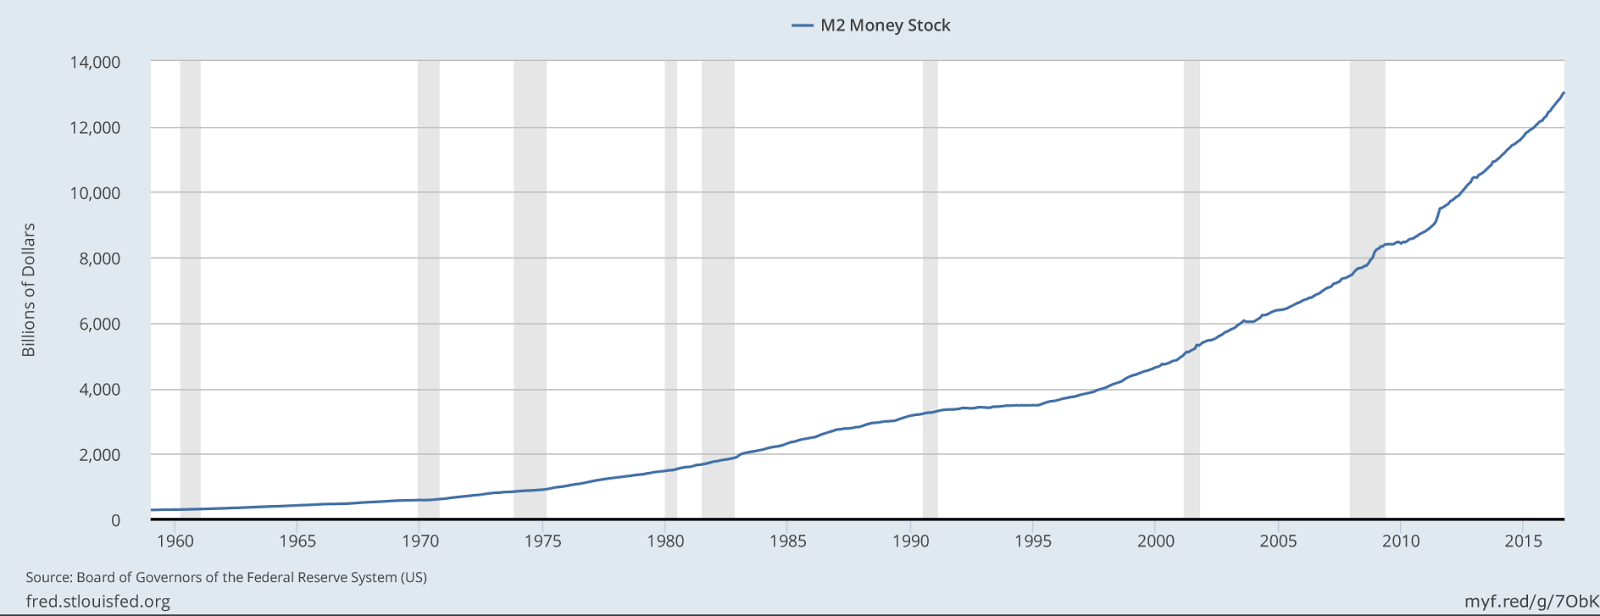
As a former full time trader on the NYSE and NASDAQ, I'm surprised an important observation on our economy has not been discussed openly in the financial news media. Most of my compatriots in the semiconductor industry are avid statisticians and share similar backgrounds in statistical process control, business planning and economic forecasting. However, I suspect many have not have seen data on the velocity of our economy (I've not seen this discussed). Here's the problem in plain sight (if you know where to look). The M2 money supply is steadily increasing as the Federal Reserve attempts to stimulate the economy.
See the FRED M2 Money Supply chart below:
(click on chart to enlarge)
(click on chart to enlarge)
Source: Federal Reserve Economic Data
As the money supply is increasing, its velocity is decreasing and headed for a crash (this phenomenon is not being discussed). What is velocity? The M2 velocity is the rate at which money changes hands. Currently, when consumers receive a pay check, most earnings stay in the bank after essential monthly bills are paid. Velocity increases with discretionary spending; the purchase of consumer goods, dining out, entertainment etc. (these activities stimulate the economy and velocity). The M2 Velocity is in an alarming dive as consumers continue to loose more of their discretionary income. The bulk of the money supply increase is being consumed by Wall Street which explains the rise in the stock market and the decline of middle class (and low income) households. As such, there is no real economic recovery in progress as reality is being masked by Wall Street prosperity.
See the FRED M2 velocity chart below:
(click on chart to enlarge)
(click on chart to enlarge)

Source: Federal Reserve Economic Data
We continue to see news stories about Wall Street gains along with monthly cheers for small, incremental increases in the employment rate while puzzling over our economic stagnation. The Obama administration recently ceased the publication of the complete scale of unemployment data publishing only the U3 component which approximates 4.9%. The current, actual U6 unemployment component which totals all unemployed and those who would like to work, approximates 9.5% (see the Bureau of Labor Statistics Table A-15 for the full data set which is still published) . With almost 10% of our nation unemployed we have a serious problem. Federal Reserve Chair Janet Yellen correctly observed and reported the unemployment dilemma immediately after taking office. Interestingly, I've not seen her discuss the M2 Velocity problem. The economy is stalled like an airplane with insufficient speed to remain airborne. As the inflation rate is in single digits, Yellen is reluctant to raise interest rates for fear of stalling the M2 velocity further and crashing our consumer economy even though Wall Street continues to benefit from the economic stimulus of the M2 money supply. Click here to see the current (complete) unemployment data chart from the US Bureau of Labor Statistics.Obama Care has crippled the economy, placing greater financial burdens on employers and individuals alike by discouraging the hire of new, full time employees and increasing health care insurance premiums and deductibles. We need to restore a competitive economic environment (on many fronts) and secure full employment for all Americans if we are to again achieve economic prosperity for our nation. For more Federal Reserve Economic Data (FRED) visit https://fred.stlouisfed.org/
Be sure to vote on November 8.
Corrections and clarification:
In reviewing this post I must correct/clarify/qualify my excerpted statements below:
“Currently, when consumers receive a pay check, most earnings stay in the bank after essential monthly bills are paid.”
“The M2 Velocity is in an alarming dive as consumers continue to loose more of their discretionary income.”
While the M2 is in an alarming dive, the fact is that currently reported FRED data indicates an incremental increase in discretionary income and consumer spending. I made the above statements based on widely reported observations and anticipation that discretionary income will likely decrease given the anticipated FY 2017 increase in costs for Obama care and related health care insurance for consumers. While these observations may prove to be true if health care expenses increase next year as anticipated, we must use currently available data for discussion purposes. FRED defines M1 and M2 velocity data as follows:
“The velocity of money is the frequency at which one unit of currency is used to purchase domestically produced goods and services within a given time period. In other words, it is the number of times one dollar is spent to buy goods and services per unit of time. If the velocity of money is increasing, then more transactions are occurring between individuals in an economy. The frequency of currency exchange can be used to determine the velocity of a given component of the money supply, providing some insight into whether consumers and businesses are saving or spending their money. There are several components of the money supply,: M1, M2, and MZM (M3 is no longer tracked by the Federal Reserve); these components are arranged on a spectrum of narrowest to broadest. Consider M1, the narrowest component. M1 is the money supply of currency in circulation (notes and coins, traveler’s checks [non-bank issuers], demand deposits, and checkable deposits). A decreasing velocity of M1 might indicate fewer short term consumption transactions are taking place. We can think of shorter term transactions as consumption we might make on an everyday basis. The broader M2 component includes M1 in addition to saving deposits, certificates of deposit (less than $100,000), and money market deposits for individuals. Comparing the velocities of M1 and M2 provides some insight into how quickly the economy is spending and how quickly it is saving.”
Source: Federal Reserve Bank of St. Louis, Velocity of M2 Money Stock [M2V], retrieved from FRED, Federal Reserve Bank of St. Louis; https://fred.stlouisfed.org/series/M2V, November 8, 2016.
My apologies for any confusion concerning this data.
Thomas D. Jay 11/8/2016
Thomas D. Jay
Semiconductor Industry Consultant
Thomas.Dale.Jay@gmail.com
https://ThomasDaleJay.blogspot.com
Thomas D. Jay YouTube Channel
Visit my new Amateur Radio blog at:
www.WA2HXR.blogspot.com


Federal Reserve Economic Data (FRED) web site. https://fred.stlouisfed.org/
US Bureau of Labor Statistics Table A-15 Unemployment Data http://www.bls.gov/news.release/empsit.t15.htm
Semiconductor Industry Consultant
Thomas.Dale.Jay@gmail.com
https://ThomasDaleJay.blogspot.com
Thomas D. Jay YouTube Channel
Visit my new Amateur Radio blog at:
www.WA2HXR.blogspot.com
Corporate, private entities or publications referenced or linked in this article are the respective owners of their logos, trademarks, service marks, media content and intellectual property. Unless otherwise disclosed, Thomas D. Jay has no financial interest in companies referenced in blog articles or other published media communications. Thomas D. Jay is not a registered financial advisor. No representation is made to either buy or sell securities. Opinions expressed by Thomas D. Jay are his own. Thomas D. Jay does not employ or otherwise utilize/authorize third party agents to express his opinions, represent his interests or conduct business on his behalf except where formally contractually designated. Thomas D. Jay does not agree to indemnify or hold harmless vendors, clients or third parties to related contractual agreements and reserves the right to applicable legal remedies in lieu of arbitration. These terms are subject to change. Concerned parties should check this blog site for periodic updates.
Acknowledgments and Reference LinksFederal Reserve Economic Data (FRED) web site. https://fred.stlouisfed.org/
US Bureau of Labor Statistics Table A-15 Unemployment Data http://www.bls.gov/news.release/empsit.t15.htm